Wikipedia:Graphics Lab/Map workshop/Archive/Feb 2021 Source: en.wikipedia.org/wiki/Wikipedia:Graphics_Lab/Map_workshop/Archive/Feb_2021
| This is an archive of past discussions on Wikipedia:Graphics Lab, for the period 2020. Do not edit the contents of this page. If you wish to start a new discussion or revive an old one, please do so on the current main page. |

New York City district maps
-
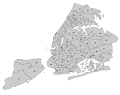 map of 51 districts

- Article(s)
- New York City Council
- Request
- This is a bit of an involved request (it's actually a two part request), but perhaps someone is willing to take a shot at doing it. There are currently eternal links to individual district maps embedded into the table in New York City Council#Districts. I'm wondering if anyone can figure a way to (1) create a map for all of the districts as a whole (like used File:Chicago City Council Wards.svg in Chicago City Council) and (2) individual maps for each district like the ones used in Los Angeles City Council. A general map for New York City's districts can be seen here; so, maybe there's a way to work from that to the aforementioned maps. It's a big task that probably will take some time, but I'm just curious if it's feasible. -- Marchjuly (talk) 06:32, 11 February 2021 (UTC)
- Discussion
![]() Request taken by DutchTreat (talk) 18:08, 16 February 2021 (UTC).
Request taken by DutchTreat (talk) 18:08, 16 February 2021 (UTC).
- @Marchjuly: On the first part, I will draft a map of the 51 council districts. The georeferenced data on district boundaries is open data. The second part of creating 51 individual maps is feasible. Let me think about creating a script for this. I'll get back to you in a few days. - DutchTreat (talk) 18:08, 16 February 2021 (UTC)
- @Marchjuly: Completed the complete map of all 51 districts. See the image above. This image can be used to highlight each district via zoom and crop as shown on the pages: District 1 (New York City Council) and District 51 (New York City Council). These technical allows for one basemap that can be updated which will automatically be applied to each district page. FOr putting all 51 maps on the same page, not sure of the performance impact. Please share your thoughts on this approach. - DutchTreat (talk) 17:01, 21 February 2021 (UTC)
- Thank you for doing that DutchTreat. Is it possible to use zoom for the individual district entires in the "New York City Council" article? If that can work, then individual images would probably not be necessary. -- Marchjuly (talk) 05:57, 24 February 2021 (UTC)
- Marchjuly Functionly, no problem with referring to the same basemap image 51 times, once for each district. Since the basemap is large (>2 MiB), not sure if the performance penalty. I'll set up a sample page in my user-space and run a test. Will get back to you in a few days. Thanks for the feedback. - DutchTreat (talk) 15:11, 2 March 2021 (UTC)
- Thanks again for your help here DutchTreat. -- Marchjuly (talk) 22:17, 3 March 2021 (UTC)
- Marchjuly Functionly, no problem with referring to the same basemap image 51 times, once for each district. Since the basemap is large (>2 MiB), not sure if the performance penalty. I'll set up a sample page in my user-space and run a test. Will get back to you in a few days. Thanks for the feedback. - DutchTreat (talk) 15:11, 2 March 2021 (UTC)
- Thank you for doing that DutchTreat. Is it possible to use zoom for the individual district entires in the "New York City Council" article? If that can work, then individual images would probably not be necessary. -- Marchjuly (talk) 05:57, 24 February 2021 (UTC)
- @Marchjuly: Completed the complete map of all 51 districts. See the image above. This image can be used to highlight each district via zoom and crop as shown on the pages: District 1 (New York City Council) and District 51 (New York City Council). These technical allows for one basemap that can be updated which will automatically be applied to each district page. FOr putting all 51 maps on the same page, not sure of the performance impact. Please share your thoughts on this approach. - DutchTreat (talk) 17:01, 21 February 2021 (UTC)
- Marchjuly A work in progress at User:DutchTreat/Projects/Maps/nyc-council-districts. There are two different approachs I'm trying. My preferred method using OpenStreetMaps might have a limitations. Using the Zoom/Pan on the SVG file does seem to work with little performance penalty. - DutchTreat (talk) 12:55, 7 March 2021 (UTC)
- Marchjuly Completed my work on the 51 district maps using {{maplink}}. See the User:DutchTreat/Projects/Maps/nyc-council-districts. Each dstrict is defined as a Data map object in Commons. Then maplink template used on WP references each map file to draw an interactive map for the council boundaries. I like this approach best since the street level map is shown as a tile background and the map is zoomable for detailed viewing. Please give me any feedback if you would like any changes. If no issue with this approach, go ahead and use them. - DutchTreat (talk) 11:08, 14 March 2021 (UTC)
- Thank you so much for doing that DutchTreat. Can the version you created simply be copied and pasted in to the "Map" column of the table? -- Marchjuly (talk) 01:13, 16 March 2021 (UTC)
- Marchjuly I think you already know the answer, but want to close the loop. Yes, simple copy/paste should work. Please add {{resolved}} if no further work is needed from your original request. - DutchTreat (talk) 20:41, 19 March 2021 (UTC)
- Yes, I figured it out. Anything that still needs to be sorted out can be done on the article's talk page. Thanks again for all your help. -- Marchjuly (talk) 22:38, 19 March 2021 (UTC)
- Marchjuly I think you already know the answer, but want to close the loop. Yes, simple copy/paste should work. Please add {{resolved}} if no further work is needed from your original request. - DutchTreat (talk) 20:41, 19 March 2021 (UTC)
- Thank you so much for doing that DutchTreat. Can the version you created simply be copied and pasted in to the "Map" column of the table? -- Marchjuly (talk) 01:13, 16 March 2021 (UTC)
- Marchjuly Completed my work on the 51 district maps using {{maplink}}. See the User:DutchTreat/Projects/Maps/nyc-council-districts. Each dstrict is defined as a Data map object in Commons. Then maplink template used on WP references each map file to draw an interactive map for the council boundaries. I like this approach best since the street level map is shown as a tile background and the map is zoomable for detailed viewing. Please give me any feedback if you would like any changes. If no issue with this approach, go ahead and use them. - DutchTreat (talk) 11:08, 14 March 2021 (UTC)
{{Resolved}}
Exhibition of Achievements of National Economy
Hi. can you please make a map of this site ?. טיוליק (talk) 18:45, 21 January 2021 (UTC)
New Zealand wine regions map
-
 Existing map of New Zealand wine GI regions

- Article(s)
- New Zealand wine
- Request
- Hi folks - I put an initial query up, probably in the wrong place, about 3 years ago, here. I would like to improve the New Zealand wine article with a decent map of the geographical indications. As you can see, I've made a somewhat amateurish attempt at it myself, but I am by no means an expert at cartography or indeed computer graphics in general. Source satellite map images (and ESRI shape data files) for the exact boundaries of each GI region can be found at the the IPONZ GI register - for instance, for Auckland. Any help appreciated. — Jon (talk) 04:01, 19 February 2021 (UTC)
- Discussion
@Jonathanischoice: ![]() Request taken by Amitchell125 (talk) 15:55, 18 March 2021 (UTC).
Request taken by Amitchell125 (talk) 15:55, 18 March 2021 (UTC).

map  Done—please let me know if you want any changes, they are easily done. The regions are all now registered, so the key is not needed. Regards, Amitchell125 (talk) 12:29, 23 March 2021 (UTC)
- Hi - looks great, thank you! Just a few small things: 1. Gisborne is spelled without the "u"; 2. can we link the two zoomed-in areas to a box outline on the main map, and 3. it's not clear that Central Hawke's Bay is a subregion of Hawke's Bay, similarly North Canterbury and the larger Canterbury region. – Jon (talk) 12:08, 25 March 2021 (UTC)
- ! & 2 done, but not 3, as there are no sub-regions. Your comment seems to assume the regional boundaries are included in the map, and they aren't (except when a geographical indicator boundary happens to run along a regional boundary). Canterbury is good example of this. Amitchell125 (talk) 13:50, 25 March 2021 (UTC)
- Thanks for the updates. I'm not sure what you mean regarding sub-regions, though. The New Zealand GI Register clearly states (per your example) that Canterbury "has 2 local Geographical Indications within it" and the Canterbury page states that "Canterbury has two geographical indication that are wholly or partly within its area" namely North Canterbury and Waipara. I was attempting to indicate this on the original map by using coloured borders, and smaller font for the sub-regions.— Jon (talk) 20:54, 25 March 2021 (UTC)
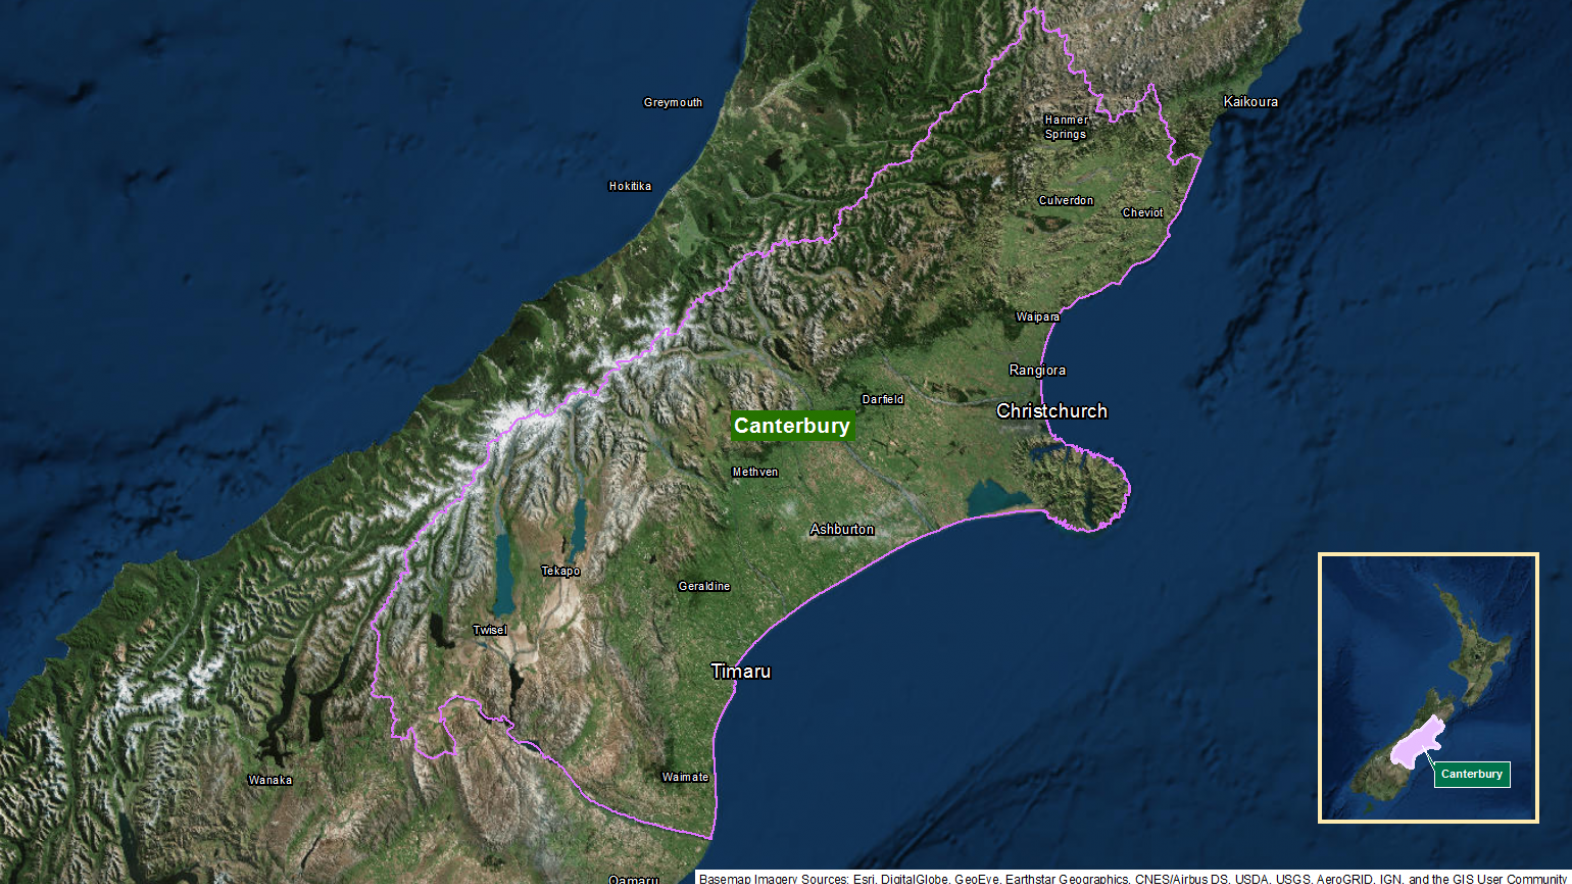
- OK, but look at a map of Canterbury (A) and compare it with the wine regions 'Canterbury' (B) and 'North Canterbury' (C), they're not the same, i.e. B+C does not equal A. If you want me to add the NZ regions so that differences can be seen, I can do it for you. :) Amitchell125 (talk) 23:10, 25 March 2021 (UTC)
- Thanks for the updates. I'm not sure what you mean regarding sub-regions, though. The New Zealand GI Register clearly states (per your example) that Canterbury "has 2 local Geographical Indications within it" and the Canterbury page states that "Canterbury has two geographical indication that are wholly or partly within its area" namely North Canterbury and Waipara. I was attempting to indicate this on the original map by using coloured borders, and smaller font for the sub-regions.— Jon (talk) 20:54, 25 March 2021 (UTC)
- ! & 2 done, but not 3, as there are no sub-regions. Your comment seems to assume the regional boundaries are included in the map, and they aren't (except when a geographical indicator boundary happens to run along a regional boundary). Canterbury is good example of this. Amitchell125 (talk) 13:50, 25 March 2021 (UTC)
- Hi - looks great, thank you! Just a few small things: 1. Gisborne is spelled without the "u"; 2. can we link the two zoomed-in areas to a box outline on the main map, and 3. it's not clear that Central Hawke's Bay is a subregion of Hawke's Bay, similarly North Canterbury and the larger Canterbury region. – Jon (talk) 12:08, 25 March 2021 (UTC)
- Hi again, forgive me, I'm still not sure what you mean. Here are the maps for the Canterbury and North Canterbury GIs, which show that the North Canterbury GI is simply the northern half of the Canterbury GI, north of the Rakaia River. To clarify, we only want the wine region GI areas on the map, not the administrative regions of New Zealand, even though some of them have the same boundaries (e.g. Hawke's Bay, Gisborne). Moreover, the very northern-most part of the Canterbury region (Kaikoura) is part of the Marlborough GI, not the Canterbury GI. Let me know if I'm not making sense?? —Jon (talk) 06:53, 26 March 2021 (UTC)
- I think we're possible getting there, map amended (keep nudging it to what you want if necessary). Amitchell125 (talk) 09:47, 26 March 2021 (UTC)
- Excellent work, thanks so much! I think it's at a point we can use it on the article now.—Jon (talk) 09:20, 27 March 2021 (UTC)
- Sweet as. 🍷 Amitchell125 (talk) 15:18, 27 March 2021 (UTC)
- Excellent work, thanks so much! I think it's at a point we can use it on the article now.—Jon (talk) 09:20, 27 March 2021 (UTC)
- I think we're possible getting there, map amended (keep nudging it to what you want if necessary). Amitchell125 (talk) 09:47, 26 March 2021 (UTC)

{{resolved}}
Legal status of psilocybin mushrooms

- Article(s)
- Legal status of psilocybin mushrooms
- Request
- I think we should introduce a new colour for the map for countries where the law varies by state, such as the U.S. (perhaps orange). In the U.S. psilocybin mushrooms are not illegal in every state; for example, in Oregon they along with all other drugs have been decriminalised and are legal in the state for medical use in supervised settings. Helper201 (talk) 05:38, 11 February 2021 (UTC)
- Discussion
World Map of nations Requirement of president to be natural-born citizen
- Article(s)
- List of presidential qualifications by country
- Request
- Hi i am just wondering can somebody make a World Map of nations where the Requirement of president is to be natural-born citizen. the following nations have this law.
1. Mexico 2. Indonesia 3. Philippines 4. Burma 5. Brazil 6. USA 7. Uruguay 8. Argentina 9. Chile 10. Honduras
Thanks. La lopi (talk) 02:58, 26 March 2021 (UTC)
Wow thanks for the fast reply Amitchell125, i have found a couple more nations that have this requirement for president. if you could update this imfo onto the map that would be very much very much appreciated. thanks again Amitchell125 or anybody else.La lopi (talk) 03:40, 28 March 2021 (UTC) 11. Kenya 12. Nigeria 13. Venezuela 14. Colombia 15. Costa Rica 16. Peru 17. Guyana 18. Liberia 19. Uruguay 20. Albania 21. Syria 22. Belarus thanks again. La lopi (talk) 09:28, 28 March 2021 (UTC)
- You're welcome, just message my talk page if the map needs to be updated. Amitchell125 (talk) 10:03, 28 March 2021 (UTC)

![]() Request taken by Amitchell125 (talk) 20:12, 27 March 2021 (UTC).
Request taken by Amitchell125 (talk) 20:12, 27 March 2021 (UTC).
![]() Done Amitchell125 (talk) 20:48, 27 March 2021 (UTC)
Done Amitchell125 (talk) 20:48, 27 March 2021 (UTC)
- Updated. Amitchell125 (talk) 08:07, 28 March 2021 (UTC)
{{resolved}}
Samsun–Kalın railway

- Article(s)
- Samsun–Kalın railway
- Request
Hello Map Wizards,
I get my covid jab on Friday so I started armchair travelling and found this nice map by NordNordWest (talk · contribs), The Emirr (talk · contribs) and Pechristener (talk · contribs).
The small lines going east from Samsun, the 2 white circles and the words "Samsun Gewerbegerbeit" and "Çarşamba" need to be deleted as those lines are no longer used. Would that be easy for one of you guys? If so let me know before you do it and I will check all the station names to see if any need correcting.
Thanks
Chidgk1 (talk) 17:54, 1 March 2021 (UTC)
- Discussion
Chidgk1, there is no issue to fix this map. I made it, the other are only responsible for the background. Please check the station names, the I'll do the fix in one go.----Pechristener (talk) 18:21, 1 March 2021 (UTC)
- Pechristener Thanks for speedy reply. Kavak and Çeltek are missing according to the official map and I cannot see the ğ which should be in Kızoğlu - it looks like a g (although it is hard to see so I may be wrong). Yapı has been erroneously dotted. Chidgk1 (talk) 18:54, 1 March 2021 (UTC)
- Chidgk1, all done.--Pechristener (talk) 23:07, 1 March 2021 (UTC)
- Thank you
{{resolved}}
Request for Bakerloo line extension map

- Article(s)
- Bakerloo line extension
- Request
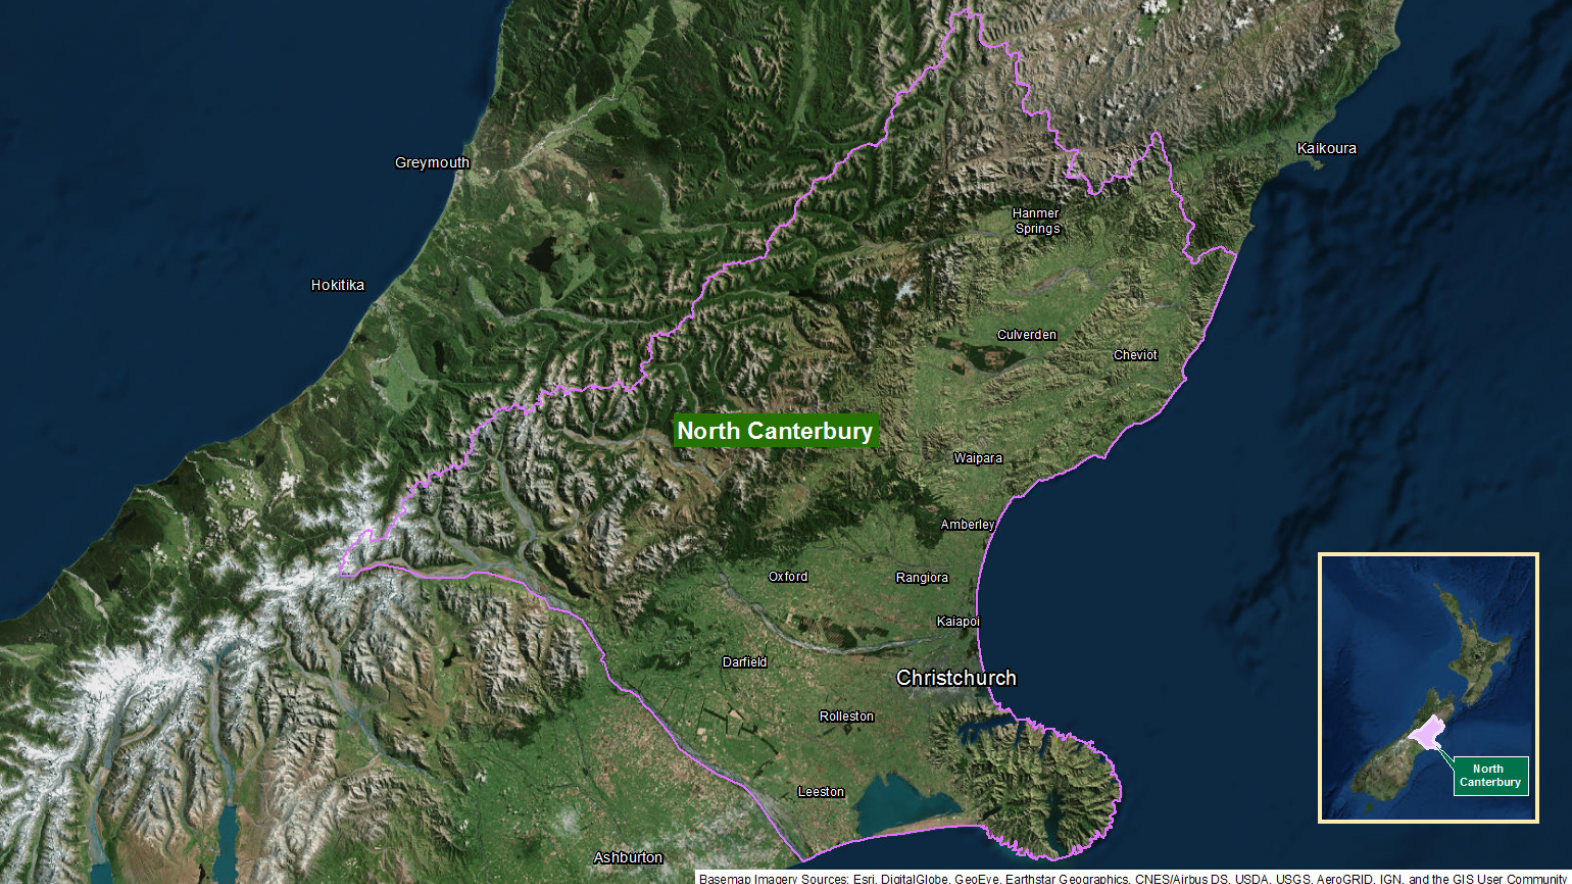
- Hello, I wonder if someone could help with a simple line diagram similar to this map on the Transport for London website? You could also trace the GIS map if a geographical map would be easier to do! I'm thinking something like this, but using the Bakerloo line colours and the TfL style (interchange blobs etc). Do let me know! Turini2 (talk) 21:36, 15 March 2021 (UTC)
- Discussion
- Resources: [1] [2] [3] [4] [5]. Might have a go at this myself, but we'll see... — Berrely • Talk∕Contribs 17:15, 29 March 2021 (UTC)
- Done File:London Underground proposed Bakerloo line extension map.svg, not sure why there is a lot of space around it, trying to fix that. Feel free to ask for any changes Turini2 — Berrely • Talk∕Contribs 18:54, 29 March 2021 (UTC)
- Hi User:Berrely - this looks good! Thanks!Turini2 (talk) 19:56, 29 March 2021 (UTC)
{{resolved}}
Map update request

- Article(s)
- Pirate Parties International
- Request
- This map is outdated. The Pirate Party UK dissolved in November 2020 and the country now has no registered or active pirate party so its colour on the map needs to be changed. The map may require other updates but this is one I have identified. If someone could please update the UK to the correct colour it would very much be appreciated. Helper201 (talk) 23:52, 20 March 2021 (UTC)
- Discussion
![]() Request taken by Amitchell125 (talk) 13:11, 28 March 2021 (UTC).
Request taken by Amitchell125 (talk) 13:11, 28 March 2021 (UTC).
![]() Done Amitchell125 (talk) 13:16, 28 March 2021 (UTC)
Done Amitchell125 (talk) 13:16, 28 March 2021 (UTC)
{{resolved}}
Change map label
-
 Map of Tasmanian electoral divisions
 -
 Final
Final


- Article(s)
- Tasmanian House of Assembly
- Request
- A few years ago, the Division of Denison got renamed the Division of Clark, but the map still shows it as Denison. If this were an SVG, I assume the fix would be easy; since it's a PNG, and the label overlaps a complicated coastal area, is it possible to fix it? Nyttend backup (talk) 11:29, 27 March 2021 (UTC)
- Discussion
- To be honest, it looks like it would be easiest just to remake this as an SVG, but I'm struggling to find a data source. — Berrely • Talk∕Contribs 15:35, 27 March 2021 (UTC)
 Request taken. Having a go at this, make not get the time to finish it but hopefully will. — Berrely • Talk∕Contribs 16:32, 27 March 2021 (UTC)
- Done took me a while to find a data source but made File:Tasmania electoral divisions 2016.svg. Hopefully this is good! (After about an hour of working on this I discovered File:Map of Tasmanian Legislative Council electoral divisions.svg and sorta lost my mind). Nyttend backup — Berrely • Talk∕Contribs 17:33, 27 March 2021 (UTC)
US {{resolved}}
US States which Ban fracking Map

- Article(s)
- Hydraulic fracturing in the United States
- Request
- Hi i am just wondering can sombody make a US map of states which Ban fracking.
1. Vermont banned it in 2012 2. Maryland banned it in 2017 3. Washington banned it in 2019 4. New York bans it as well. Thanks. La lopi (talk) 09:21, 29 March 2021 (UTC)
- Discussion
- Done La lopi at File:Map of US states that ban fracking.svg. — Berrely • Talk∕Contribs 17:34, 30 March 2021 (UTC)
Thanks for it Berrely.La lopi (talk) 03:23, 31 March 2021 (UTC)
{{resolved}}
Map Update

- Article(s)
- Sanctuary city
- Request
Hi i am just wondering can sombody update this map. On April 1, 2021, the state of montana banned Sanctuary cities in the state of montana. thanks. [1] La lopi (talk) 12:02, 3 April 2021 (UTC)
- Discussion
![]() Request taken by Amitchell125 (talk) 12:25, 5 April 2021 (UTC).
Request taken by Amitchell125 (talk) 12:25, 5 April 2021 (UTC).
![]() Done I have made an SVG version of the map here to allow other updates to be made easily if needed. Amitchell125 (talk) 12:31, 5 April 2021 (UTC)
Done I have made an SVG version of the map here to allow other updates to be made easily if needed. Amitchell125 (talk) 12:31, 5 April 2021 (UTC)
Thanks again. Amitchell125 La lopi (talk) 14:00, 5 April 2021 (UTC)
{{resolved}}
2021 Scottish Parliament election opinion poll graph updates
.png)
.png)
- Article(s)
- 2021 Scottish Parliament election and Opinion polling for the 2021 Scottish Parliament election
- Request
- The party noted as Brexit on the graph should be re-named to Reform, as the Brexit Party is now Reform UK, as is reflected in the list of parties in the first article and in each key for each of the two graphs in the opinion polling article. Helper201 (talk) 00:26, 1 March 2021 (UTC)
- Discussion
- @Helper201: You would be best contacting the creator of the graph (Humongous125). PinkPanda272 (talk/contribs) 10:11, 1 March 2021 (UTC)
- I shall endeavour to update the graphs with the correct names and new additional polls by the end of this week. Humongous125 (talk) 15:46, 3 March 2021 (UTC)
- I have made a temporary graph that you can see here. Once Humongous125 updates theirs then I am more than happy to swap it for the original one. Best, PinkPanda272 (talk/contribs) 20:54, 3 March 2021 (UTC)
- Thank you both. I look forward to seeing your new graph @Humongous125: and thanks for the temporary one PinkPanda272. Helper201 (talk) 15:37, 9 March 2021 (UTC)
- Hello @PinkPanda272: & @Helper201:, apologies for the delay. I have updated the opinion poll graphs with the most recent results. As requested I have changed the Brexit Party name and added the new Scottish parties. Humongous125 (talk) 12:57, 5 April 2021 (UTC)
- Hi Humongous125, thanks for doing this. Will you be able to update these throughout the campaign period? The graph currently at Opinion polling for the 2021 Scottish Parliament election#Graphical Summary looks very busy - do you think it would be OK if I used Template:Switcher so readers can toggle between the constituency and regional graph instead? PinkPanda272 (talk/contribs) 13:06, 5 April 2021 (UTC)
- Hi PinkPanda272 yes I can update the graphs during the campaign. (I had stopped updating as I misplaced the file.) Sure, it is looking busy now. I think it looked okay when there was only a few polls a month but having thought about it the switcher is probably more appropriate now. Humongous125 (talk) 22:15, 5 April 2021 (UTC)
- That's great, I've implemented the Switcher template in the article. PinkPanda272 (talk/contribs) 08:42, 6 April 2021 (UTC)
- Hi PinkPanda272 yes I can update the graphs during the campaign. (I had stopped updating as I misplaced the file.) Sure, it is looking busy now. I think it looked okay when there was only a few polls a month but having thought about it the switcher is probably more appropriate now. Humongous125 (talk) 22:15, 5 April 2021 (UTC)
- Hi Humongous125, thanks for doing this. Will you be able to update these throughout the campaign period? The graph currently at Opinion polling for the 2021 Scottish Parliament election#Graphical Summary looks very busy - do you think it would be OK if I used Template:Switcher so readers can toggle between the constituency and regional graph instead? PinkPanda272 (talk/contribs) 13:06, 5 April 2021 (UTC)
- Hello @PinkPanda272: & @Helper201:, apologies for the delay. I have updated the opinion poll graphs with the most recent results. As requested I have changed the Brexit Party name and added the new Scottish parties. Humongous125 (talk) 12:57, 5 April 2021 (UTC)
- Thank you both. I look forward to seeing your new graph @Humongous125: and thanks for the temporary one PinkPanda272. Helper201 (talk) 15:37, 9 March 2021 (UTC)
{{resolved}}
minimally useful map in Alaska
- Article
- Request

As was pointed out at Talk:Matanuska-Susitna Valley this map is basically useless to anyone with color blindness, and not much better for those who do not have it. It is unfortunately in use in quite a number of different projects, simply because it is the only map we have. I'm not sure how the original creator of the map made the decision to place the borders where they did, the Matanuska part of the valley extends all the way to Matanuska Glacier. I will endeavor to locate some sources that define the valley borders. Beeblebrox (talk) 23:01, 2 April 2021 (UTC)
- hopefully these help:
- Beeblebrox (talk) 23:07, 2 April 2021 (UTC)
- This tweet [6] shows a very different map. (and also points out that they are really two valleys, and it's just a cultural/political thing that they are referred to as one thing.) Beeblebrox (talk) 23:11, 2 April 2021 (UTC)
- Discussion

![]() Request taken by Amitchell125 (talk) 21:36, 5 April 2021 (UTC).
Request taken by Amitchell125 (talk) 21:36, 5 April 2021 (UTC).
- Hi Beeblebrox, I'm assuming you want a map along the lines of this one. Is that OK? Amitchell125 (talk) 21:36, 5 April 2021 (UTC)
- That certainly looks better. Thanks! Beeblebrox (talk) 21:48, 5 April 2021 (UTC)
- Hi Beeblebrox, map now Done. Please tell of of any amendments—I can amend anything you think needs to be altered, now it's got to this stage. Regards, Amitchell125 (talk) 21:23, 8 April 2021 (UTC).
- Awesome, thanks again! Beeblebrox (talk) 21:40, 8 April 2021 (UTC)
- Hi Beeblebrox, map now
- That certainly looks better. Thanks! Beeblebrox (talk) 21:48, 5 April 2021 (UTC)
{{resolved}}
Blank Map
- Article(s)
- Province No. 1 and many
- Request
- Hi, someone please make a blank map of Province No. 1 showing local level bodies… -- 👤Raju💌 13:05, 13 February 2021 (UTC)
- Discussion
![]() Request taken by Amitchell125 (talk) 16:05, 28 March 2021 (UTC).
Request taken by Amitchell125 (talk) 16:05, 28 March 2021 (UTC).
![]() Done Amitchell125 (talk) 12:47, 31 March 2021 (UTC)
Done Amitchell125 (talk) 12:47, 31 March 2021 (UTC)
Please let me know what amendments you would like, as I can change the colours quite easily. Amitchell125 (talk) 12:52, 31 March 2021 (UTC)
- The colours are looking great but will be good if you can upload an another map in white only. Thank you so much ✌️. 👤Raju💌 03:18, 2 April 2021 (UTC)
- Sorry Sir! There is a mistake. In geo-code section 102, you have coloured subsection 01, 02, 03 in one colour and 04 to 10 in another colour. All subsection should be one colour because they are part of one district. Thanks 👤Raju💌 03:37, 2 April 2021 (UTC)
- New black and white maps are here and here. Happy to help. Amitchell125 (talk) 08:09, 2 April 2021 (UTC)
- Sorry Sir! There is a mistake. In geo-code section 102, you have coloured subsection 01, 02, 03 in one colour and 04 to 10 in another colour. All subsection should be one colour because they are part of one district. Thanks 👤Raju💌 03:37, 2 April 2021 (UTC)
- The colours are looking great but will be good if you can upload an another map in white only. Thank you so much ✌️. 👤Raju💌 03:18, 2 April 2021 (UTC)
_no_shading.svg)
.svg)
{{resolved}}
Gorky Park (Moscow) + Sokolniki Park
Hi. can you please make a maps of this two parks ?. טיוליק (talk) 15:50, 7 February 2021 (UTC)
- טיוליק It would help us graphic workers if you used the "New request" link at the top of this page. You will find it in the green filed. When you use that link the request will follow the same standard as the rest so it will be easier for us to see, understand and be able to work with them, thanks.
- I'm considering to take this request but I will wait for you to get back here as I always want the support of the requester to be able to create as good work as possible, you have the knowledge of this subject, not me. Please always ping me, thanks. --Goran tek-en (talk) 18:53, 25 February 2021 (UTC)